Net Importers and Exporters: European Renewable and Nuclear Guarantees of Origin Market Dynamics
Importing a Guarantee of Origin refers to receiving a GO that was produced in another country. Exporting a Guarantee of Origin means the opposite: transferring a certificate away from its registry of origin into another country’s registry.
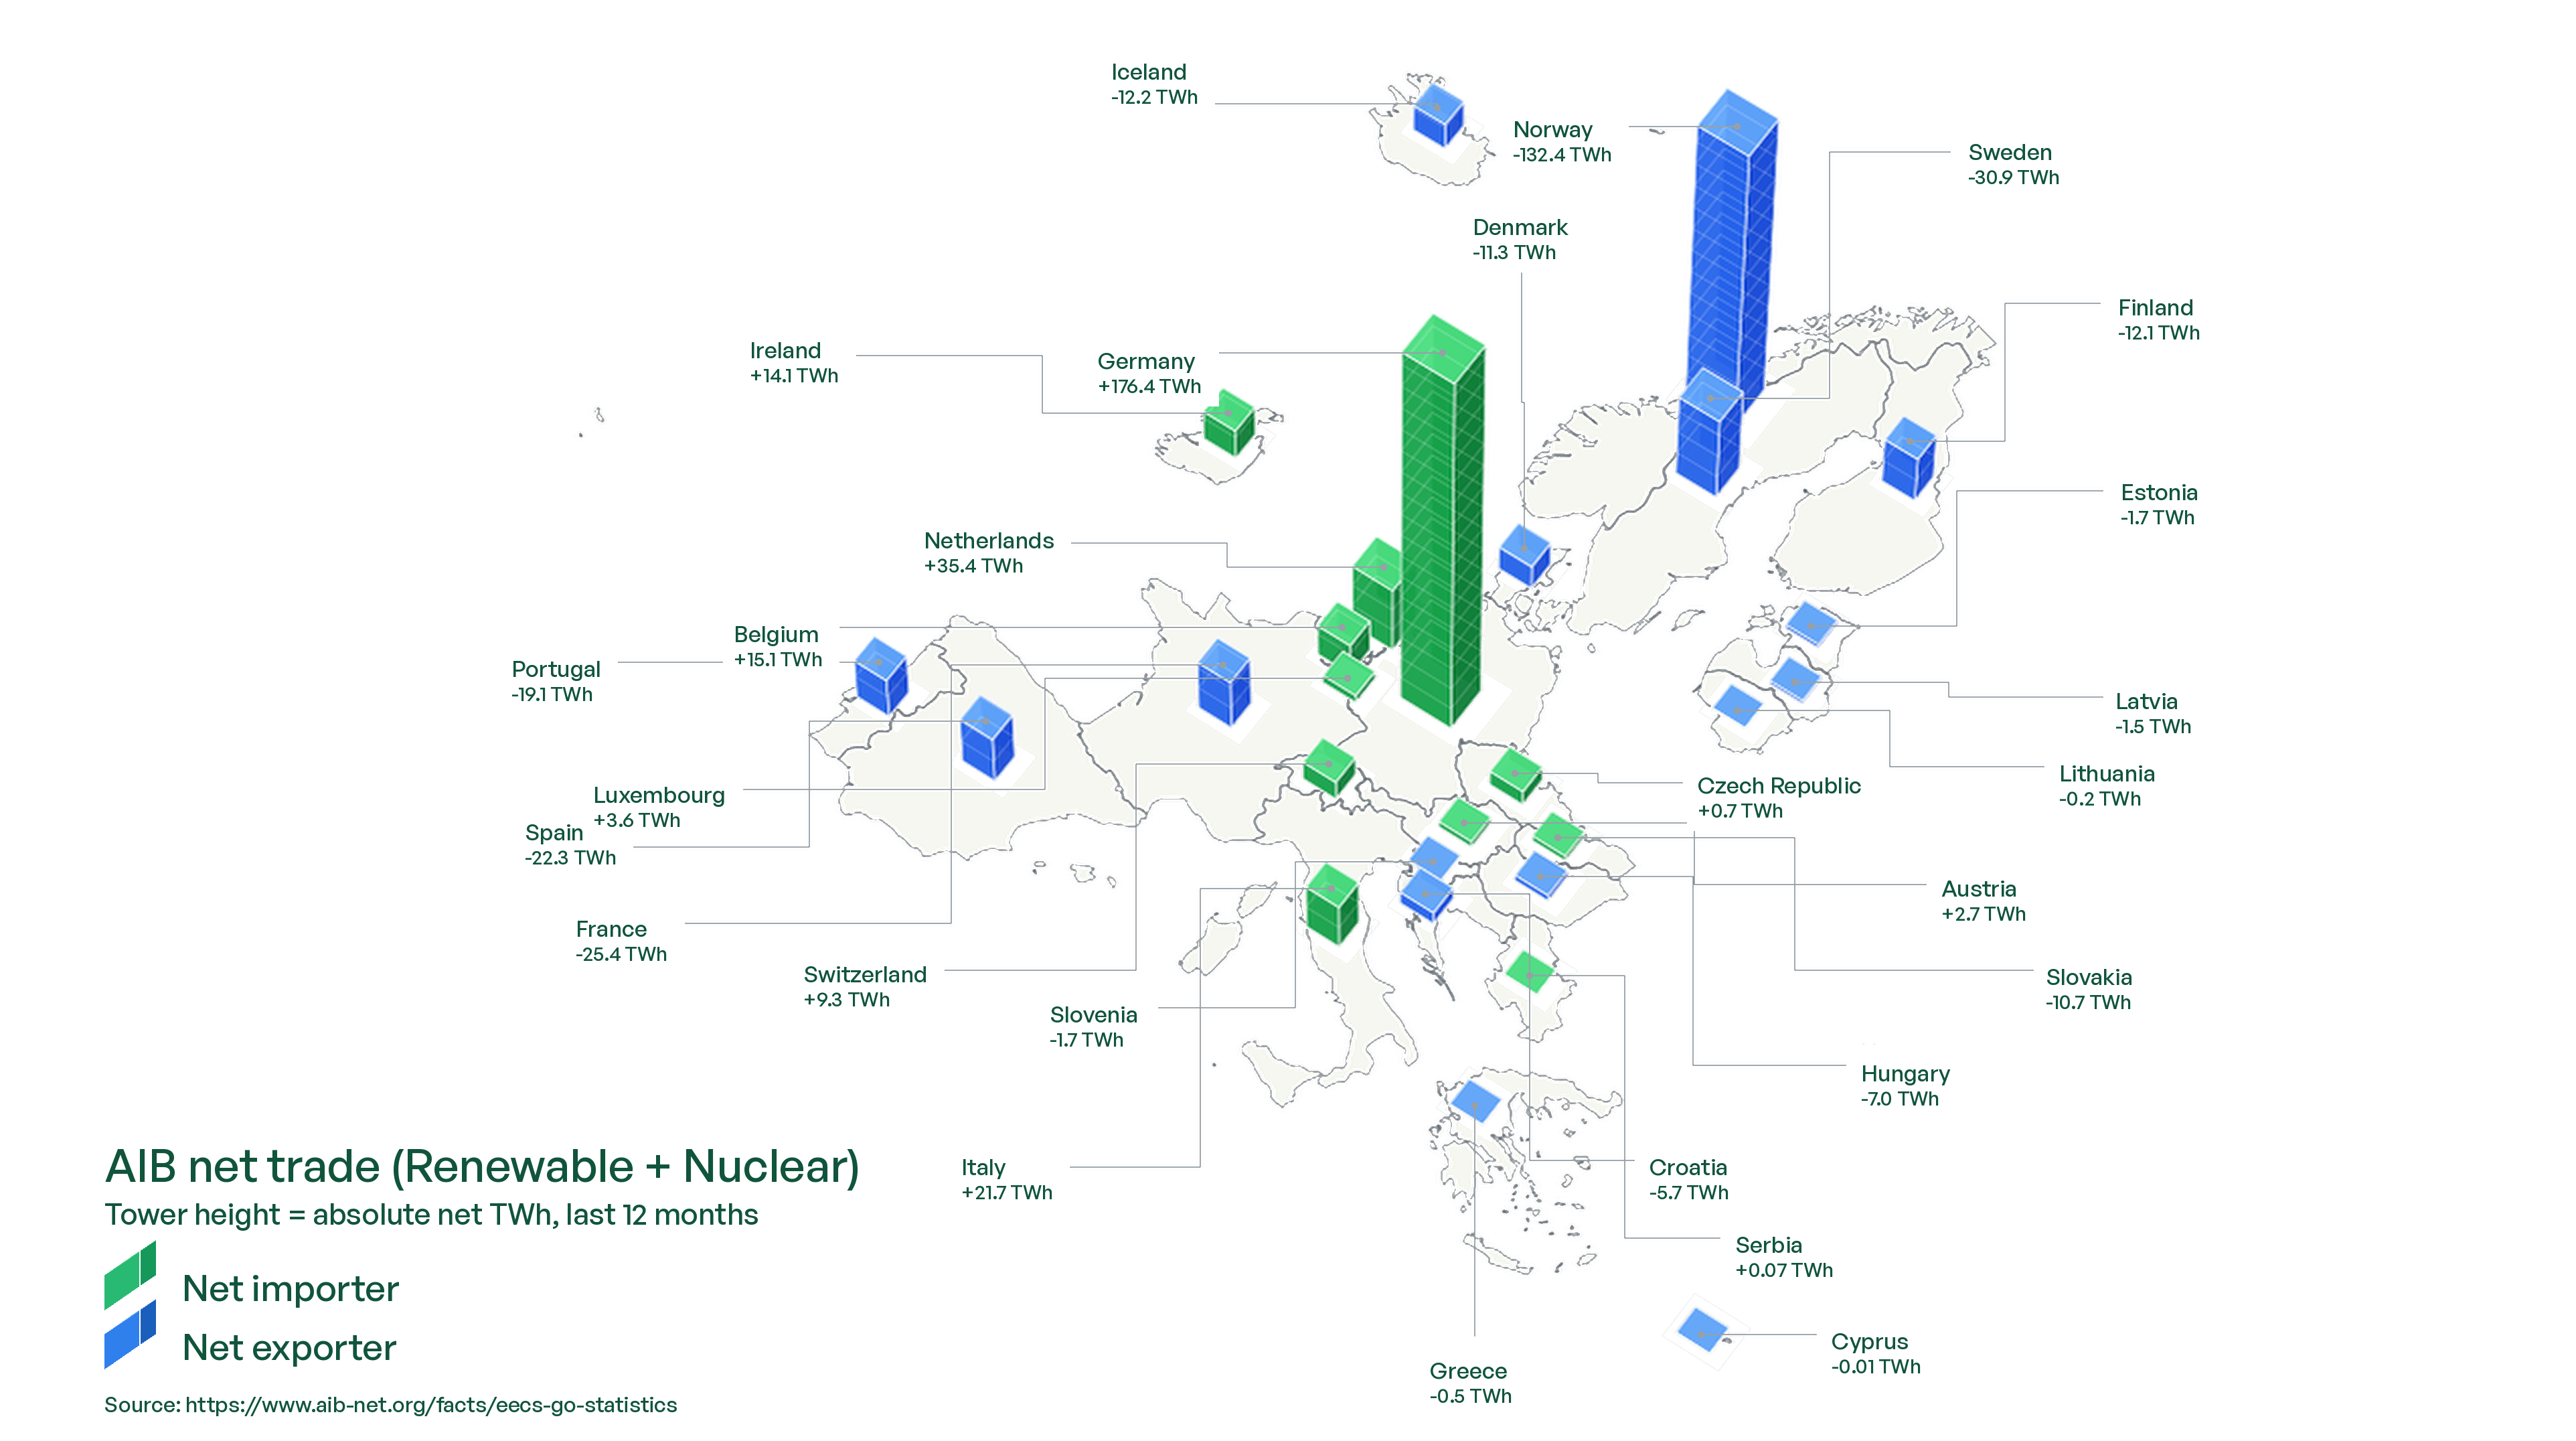
As per AIB renewable and nuclear certificate data, certain countries import more GOs than they export, which makes them net importers, and vice versa for net exporters. This is an important read on geographic premiums and market pockets, because long-standing net imports can show where GO demand exceeds domestic issuance.
The following map and tables reflect AIB renewable and nuclear certificate data. They are updated whenever new data arrives, and give an orderly breakdown of net importers and exporters in the European Guarantee of Origin market. This batch shows net trades in the 12 months running up to June 2026, as per AIB data.
Net trade map: renewable + nuclear certificates
Net importers: renewable + nuclear certificates
| Country | Total imports | Total exports | Net balance + |
|---|---|---|---|
| Germany | 220 TWh | 43.8 TWh | +176 TWh |
| Netherlands | 75.0 TWh | 39.6 TWh | +35.4 TWh |
| Italy | 77.1 TWh | 55.4 TWh | +21.7 TWh |
| Belgium | 59.7 TWh | 44.7 TWh | +15.1 TWh |
| Ireland | 16.6 TWh | 2.48 TWh | +14.1 TWh |
| Switzerland | 13.9 TWh | 4.64 TWh | +9.31 TWh |
| Luxembourg | 4.00 TWh | 0.37 TWh | +3.62 TWh |
| Austria | 20.0 TWh | 17.2 TWh | +2.74 TWh |
| Czechia | 8.16 TWh | 7.44 TWh | +0.72 TWh |
| Serbia | 0.21 TWh | 0.14 TWh | +0.07 TWh |
Net exporters: renewable + nuclear certificates
| Country | Total imports | Total exports | Net balance - |
|---|---|---|---|
| Norway | 428 TWh | 561 TWh | -132 TWh |
| Sweden | 55.5 TWh | 86.4 TWh | -30.9 TWh |
| France | 86.4 TWh | 112 TWh | -25.4 TWh |
| Spain | 21.7 TWh | 44.0 TWh | -22.3 TWh |
| Portugal | 12.5 TWh | 31.6 TWh | -19.1 TWh |
| Iceland | 4.50 TWh | 16.7 TWh | -12.2 TWh |
| Finland | 43.5 TWh | 55.6 TWh | -12.1 TWh |
| Denmark | 30.5 TWh | 41.7 TWh | -11.3 TWh |
| Slovakia | 5.48 TWh | 16.2 TWh | -10.7 TWh |
| Hungary | 5.00 TWh | 12.0 TWh | -7.00 TWh |
| Croatia | 0.94 TWh | 6.69 TWh | -5.74 TWh |
| Slovenia | 2.57 TWh | 4.30 TWh | -1.73 TWh |
| Estonia | 3.62 TWh | 5.32 TWh | -1.71 TWh |
| Latvia | 0.74 TWh | 2.28 TWh | -1.54 TWh |
| Greece | 10.2 TWh | 10.7 TWh | -0.51 TWh |
| Lithuania | 3.46 TWh | 3.64 TWh | -0.18 TWh |
| Cyprus | 16.3 GWh | 22.4 GWh | -6.16 GWh |
Be sure to bookmark this page and check back in a few months. Whenever AIB data is posted, the content on this page will be updated.
For more information about how market intelligence, procurement automations and portfolio management can influence your Guarantee of Origin strategy, book a demo to chat with a member of our team.
You're halfway there...
Sign up free to keep reading immediately and get Soldera's EAC market research, price updates, quarterly outlooks and renewable compliance insights direct to your inbox.



Schedule a 20-minute demo to find out if Soldera is right for you.